Perspective
Effect of overly tightened cable ties evenly spaced on HD-SDI cable in terms of return loss

Characteristics and ability to transfer a signal from its source to its destination with minimum losses or damage is dependent on physical design of the transmission cable. The standards defining serial digital high-definition video describe high digital data rates as the one which exceeds 3.0 Gb/s. Just like analog UHF signals, these signals also require special handling in order to properly transfer video data.
Any cable transmitting HD signal is essentially an RF transmission line and critical specification (for a transmission line) is its characteristic impedance. The maximum signal transfer from its source to its destination through a coaxial cable happens when cable impedance matches precisely with that of source and destination.
There are obviously other factors, which are also responsible for determining transmission line’s ability to carry signal without any loss. For example, in an analog video setup, the losses attributed to transmission impedance directly affect high-frequency characteristics of any image. High-frequency chroma information is reduced with increase in cable length, and the phase of video changes approx. 2-inch/foot of cable and chroma and luma will have slightly different phase angles, etc.
Abnormality of analog signal as described above does not occur to images using HD serial digital interfaces; however, digital system has altogether a new set of requirements for coaxial cable manufactures. A much precise method of handling and testing is required whenever using copper interfaces as frequency of HD is much greater.
HD frequencies and data rates
As per SMPTE standard 292M, HD serial digital video shall be formatted in 10-bit words at a data rate of approximately 1.5 Gb/s. Other physical signal requirements include the bandwidth and linearity of the interface circuitry.
A direct correlation exists between the serial digital signal data rate and its equivalent analog frequency. The equivalent analog frequency is 1/2 the data rate. For high-definition serial digital video, the data rates are 1.485 Gb/s and 1.4835 Gb/s, or:

The high-definition data rate’s equivalent fundamental frequency is approximately 740 MHz, and since the digital video is a series of 800 mV square waves, the coaxial cable must be able to minimally pass the third and fifth harmonies of the signals as well as the fundamental frequencies.
An RF system’s bandwidth is defined by its fundamental and sideband frequencies and a properly designed HD video transmission should be able to transmit video data as carrier as well as its associated electrical components (or harmonics).
In figure below, ‘A’ is the fundamental frequency. Addition of the third harmonic ‘B’ results in a waveform, approximating a square wave like ‘C’. The further addition of the fifth harmonic to ‘C’, as in ‘D’, results in nearly a square wave as in ‘E’.
The third and fifth odd harmonics of 1.485 Gb/s high-definition digital video are 2.2275 GHz and 3.7125 GHz respectively.
Transmission lines
For RF communications, at these frequencies, system interconnections require special handling. Some operators also refer to it as black magic. The transmission lines resemble plumbing, and transformers can be produced with a few turns of wire on a pencil. Though HD video data circuits do not require the same transmission elements, a careful consideration should be put in place during designing of HD signal paths. To ensure the lowest possible bit error rate, it is imperative to test the physical interface (i.e., transmission line) between HD source and its destination, and loss of video data will result in errors visible in the image.
Return loss measures the performance of cable in terms of reliability of signal transfer from point A to B. Any precision coaxial cable, which can carry an analog video signal to 333 meters will be able to carry HD signal less than 80 meters!
Return loss is the measurement of the performance of cable as it is able to reliably transfer a signal from point A to point B. Coaxial cables are imperfect, as impedance varies along its length and in process creating undesirable signal reflections and along with it the cable frequency-dependent attenuation also diminishes HD signal’s amplitude/unit length.
Definition of return loss (RL) or voltage standing wave ratio (VSWR)
The reflection coefficient of cable is related to the amount of energy reflected due to changes of impedance in transmission line length and it is also considered as one of measurement criteria of quality of said transmission line. Reflected signal heterodyne with the fundamental signal and results in different phases of the sum and difference of both frequency and phase mixed with the fundamental signal.
Return loss is calculated using the following formula:

Z1 = Standard impedance
Z2 = Z1 with tolerance
RL = Return loss
A typical high-definition video cable has nominal impedance of 75 ohm; the manufacturer specifies this impedance with a tolerance of ±1.5 ohm. The return loss of this cable can be calculated as follows:
Example 1:

RL = –20 log (0.0099)
RL = –40.08 dB
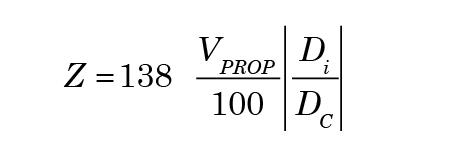
The return loss calculation above demonstrates that the coaxial cable’s performance is directly related to its impedance. The impedance is determined by the physical characteristics of the cable by the following equation:

Z = Cable impedance
VPROP = Manufacturer’s velocity of propagation
Di = Diameter of insulation
Dc = Diameter of conductor
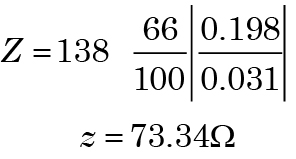
Example 2:

Using the equation in example given above to calculate the nominal impedance of this cable results in 73.34 ohm (per the manufacturer’s published specifications).
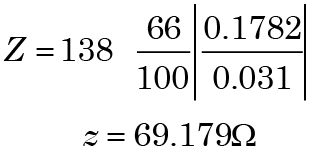
Example 3:

The calculation in Example 3 accounts for an impedance change in the same cable (when installed) with a 10 percent reduction (0.0198”) in the periodic difference of the cable’s insulation diameter, along its length producing nominal impedance of 69.1790. This minor periodic difference of less than 0.02” of diameter can be attributed to overly tightened cable ties, evenly spaced commonly used for installation.
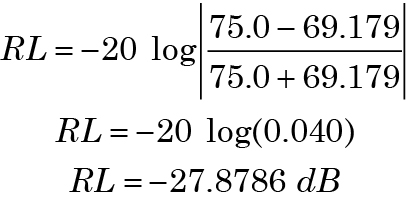
Now calculating return loss for the installed cable:
Example 4:

The return loss of the installed cable has been reduced from 40.08 dB (Example 1) to –27.88 dB (Example 4) owing to a series of overly tightened cable ties!
For HD-SDI signals, the useful maximum length is achieved when the cable produces a 20-dB loss at 1/2 the clock frequency. Following 20 dB of loss, there is not much signal left to recover!
In a studio facility, manually patching video is usually employed to provide system flexibility. For the reasons outlined above, patch cords and connections in the patch-bay all need to be monitored for return loss. A good electrical connection begins with a proper physical connection.
Eye pattern
Cable manufacturers use impedance bridges and other very sophisticated equipment to measure performance characteristics. However, the television engineer uses a different tool, a waveform monitor, capable of displaying an eye diagram of the applied signal. Rather than measuring the impedance of the interfaces, the eye diagram presents the voltage waveform of the received video data signal. After a high-definition serial digital video signal has travelled from a source device, through the coaxial cable to a destination device, its signal will be attenuated as calculated above. The cable’s characteristics (return loss value) will determine the amount of signal amplitude delivered to the destination device versus the amount lost or reflected by the cable.
Based on the amount of attenuation, the receiving device may have to recover the signal from the background noise present in the copper cable. Recovering the HD-SDI signal is generally performed by automatically adding an appropriate amount of equalization to the receiver in order to return the signal level to its nominal value of 800 mV. The problem with such active equalization systems is that they also amplify noise with the signal.
The data recovery process begins by extracting the clock information from the data. The extracted clock is then used to re-time and decode HD video data. Any noise added to the data hinders the data recovery process. The more noise present, the greater the chances that the clock cannot be recovered perfectly. The addition of noise may make it difficult to identify signal transitions. The decoded data words may not occur with the proper timing stability, resulting in a signal that jitters.
Conclusion
Testing the performance of high-definition video has its roots in high-frequency analog signal analysis (RF), high-speed data analysis, and complex video performance standards. HD signal specifications change the requirements for signal handling and monitoring. All engineers working with uncompressed, high-definition video require an awareness of these multiple disciplines test methods. The eye pattern (or eye diagram display) and jitter measurement are extremely helpful tools for troubleshooting integrity problems of any high-definition signal path.


You must be logged in to post a comment Login